Looking for Value with P/E Ratios
Many factors might go into evaluating a stock, but the price/earnings (P/E) ratio offers a helpful starting point. The P/E ratio is calculated by dividing a stock’s current price per share by the company’s earnings per share over a 12-month period. This ratio quantifies what investors may be willing to pay for one dollar of earnings.
For example, a P/E of 20 means an investor would pay $20 for every $1 the company earns over the 12-month period. By this standard, a stock with a P/E of 25 could be considered more “expensive” than a stock with a P/E of 20, regardless of the share price.
Past and Future
The most commonly referenced type of P/E ratio is trailing P/E, based on the official reported earnings per share for the previous 12 months (abbreviated ttm for trailing 12 months).
Forward P/E uses projected earnings over the next 12 months, based on information released by the company. Although this is important information for investors, the actual earnings could turn out to be very different from the projection. A stock’s share price might fall if a company misses its earnings target. On the other hand, a company that exceeds its earnings projection may see a boost in share price.
Earnings are typically reported on a quarterly basis, so the earnings part of the trailing P/E equation will generally remain the same for each three-month period, but the stock price may change every trading day, making the trailing P/E a moving target even though it measures past performance. The forward P/E will also change with stock prices and updated earnings projections.

Meaningful Comparisons
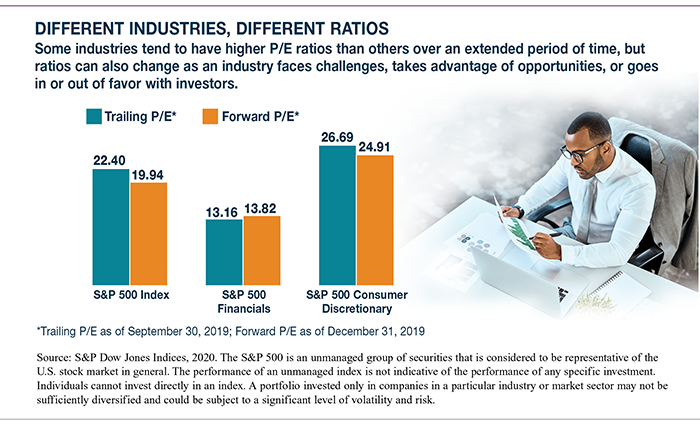
Knowing a company’s P/E ratio is valuable only if you use it to make appropriate comparisons. P/E ratios can vary widely among industries, so it is generally more meaningful to compare ratios of companies in the same industry or one company against the industry average. You might also compare a company’s current and past performance, but keep in mind that P/E ratios typically rise and fall with stock prices; if prices rise and earnings stay about the same, P/E ratios increase, and vice versa. So an increase or decrease in a company’s P/E ratio that moves with the broader market may not tell you much about the company.
On the other hand, a substantial change in a company’s P/E ratio that is not in step with the market could be caused by an unexpected increase or decrease in reported or projected earnings, or by a shift in investor confidence in the company. The same is true of a change in the P/E ratio of an industry that does not reflect broader market trends.
The return and principal value of stocks fluctuate with changes in market conditions. Shares, when sold, may be worth more or less than their original cost.
This information is not intended as tax, legal, investment, or retirement advice or recommendations, and it may not be relied on for the purpose of avoiding any federal tax penalties. You are encouraged to seek advice from an independent tax or legal professional. The content is derived from sources believed to be accurate. Neither the information presented nor any opinion expressed constitutes a solicitation for the purchase or sale of any security. This material was written and prepared by Broadridge Advisor Solutions. © 2020 Broadridge Investor Communication Solutions, Inc.
Ready to Take The Next Step?
For more information about any of our products and services, schedule a meeting today.

